By:

HOW A MULTI-LOCATION
BUSINESS SCALED
12 BRANCHES TO 60
A Private Equity Firm Acquired a 12-Location Business, Uncovered Millions in Hidden Profit, and Scaled It to 60 — Without Massive Budgets
Be honest: do you actually know which of your branches make money?

More importantly, do you know how they make it, And how they lose it?
Which products/services drive the most profit?
Which customers spend the most, and how to keep them coming back?
Where are you quietly bleeding money through overstaffing, wasted ads, or inefficient inventory?
Everything looked fine.
Until you asked the right questions.
When the firm stepped in, the business had 12 locations. Revenue was steady. Customers were walking in. Costs looked “manageable.” On the surface, it looked healthy. But leadership couldn’t clearly answer these key questions.
This is how profitable-looking businesses quietly lose millions.
Not failing.
Just partially blind.
And partial blindness at scale costs more
than just money.
Because leadership couldn’t answer those key questions, small cracks
started widening.

Staff performance was
invisible
The best performers carried
the business, but leadership
had no idea who they were

“Busy” locations bled money
A store packed with customers looked like a success… until you factored in rent, overstaffing, and wasted stock

Marketing was blind
Ads drove clicks, traffic, and
sign-ups. But nobody knew
which campaigns led to actual
profit. Dollars were flying out
the window.

Decisions were gut feel
Schedules, where to cut costs,
even expansions... all based on
instinct, not evidence.

Marketing was blind
Growth stalled. Leaders wanted to scale, but
every move felt like a risk they couldn’t measure.
This wasn’t a leadership problem. It was a visibility problem…
That’s because they were looking at each system separately:

Sales data
shows revenue, but
not profit

Marketing data
shows clicks, not paying customers

Accounting data
shows totals, but not which branch or product makes money.

Payroll alone
shows cost, but not if staff are actually productive.
That’s because they were looking at each system separately:

Sales + Accounting:
Revealed which locations/products actually make money

Sales + Marketing:
Proved which campaigns create profitable customers

Sales + Payroll:
Showed revenue per labor hour. Who’s a star and who drags you down

Sales + Inventory:
Flagged stock that moved vs. stock that died on shelves
Sales + Customer Management:
Spot loyal customers,
why they buy, and how to keep them
Alone, each system is a clue. Together, they tell the whole story
Only after the firm could clearly see where profit was created and where it was lost, did they discuss scaling. Growth wasn’t the first move. Clarity was.
Stop guessing. Start knowing. See what your data’s been hiding in a 30-minute Free Audit
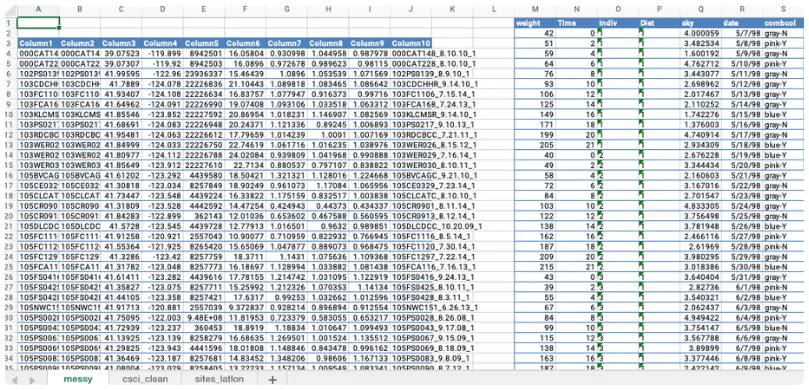
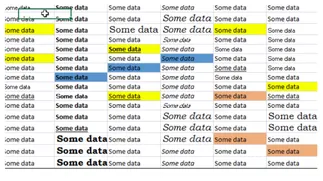
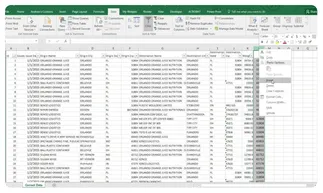
Before this, spreadsheets ran the business.
Five versions.
Twelve tabs.
Endless “final_final_v3.xlsx” files.
Every manager had their own numbers, tens of man hours wasted each week to produce these reports, and even then formulas broke. Reports arrived late, data was incomplete or inaccurate. And by the time discrepancies were discovered, money was already lost.
Spreadsheets weren’t tools anymore. Instead, they were noise.
Then they were removed from the center of decision-making.
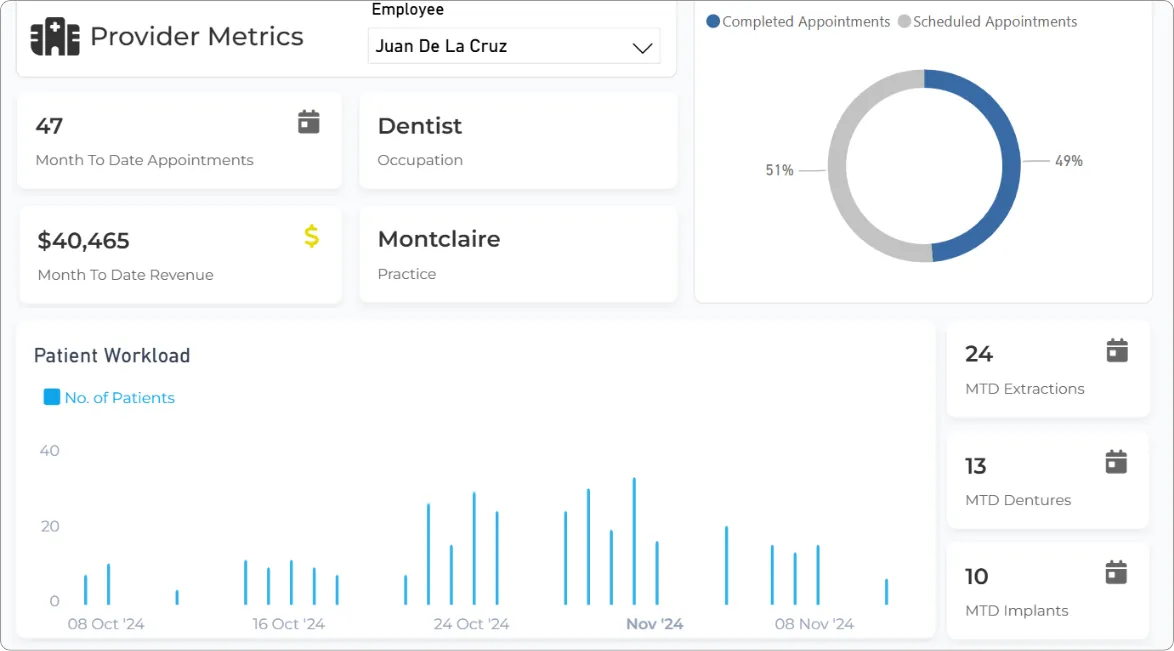
Instead of chasing files, we connected the systems behind them, by using intuitive and simple dashboards that update automatically every day as a gateway to view the insights that are brought upon connected systems.
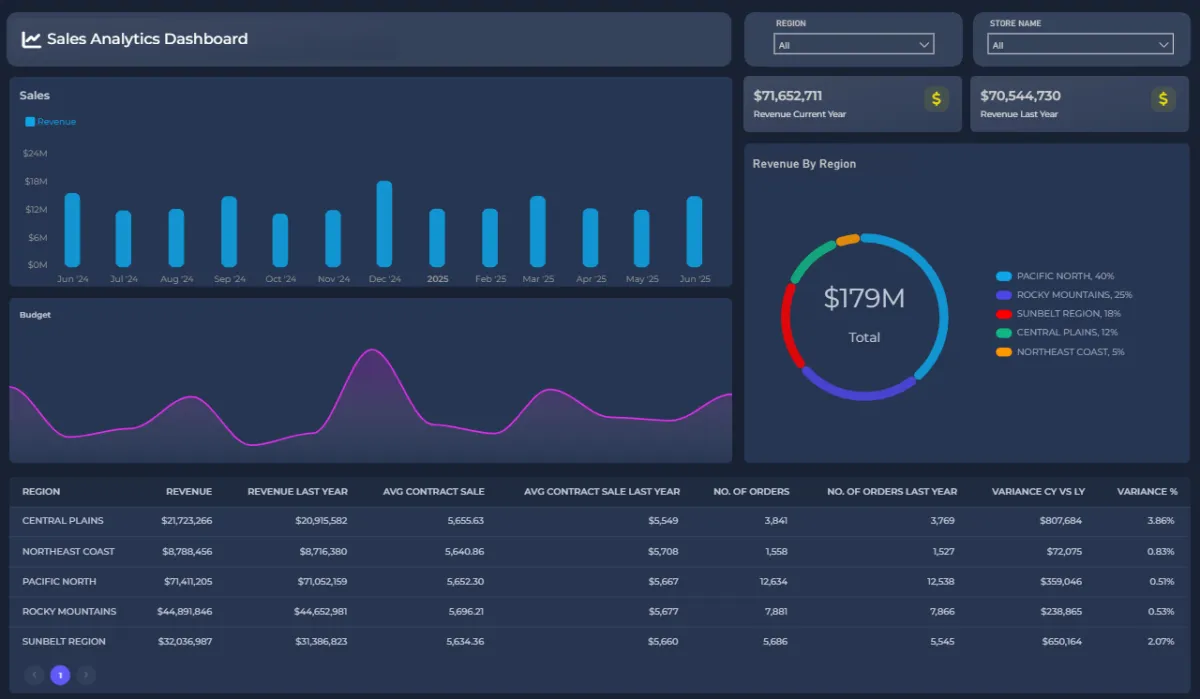
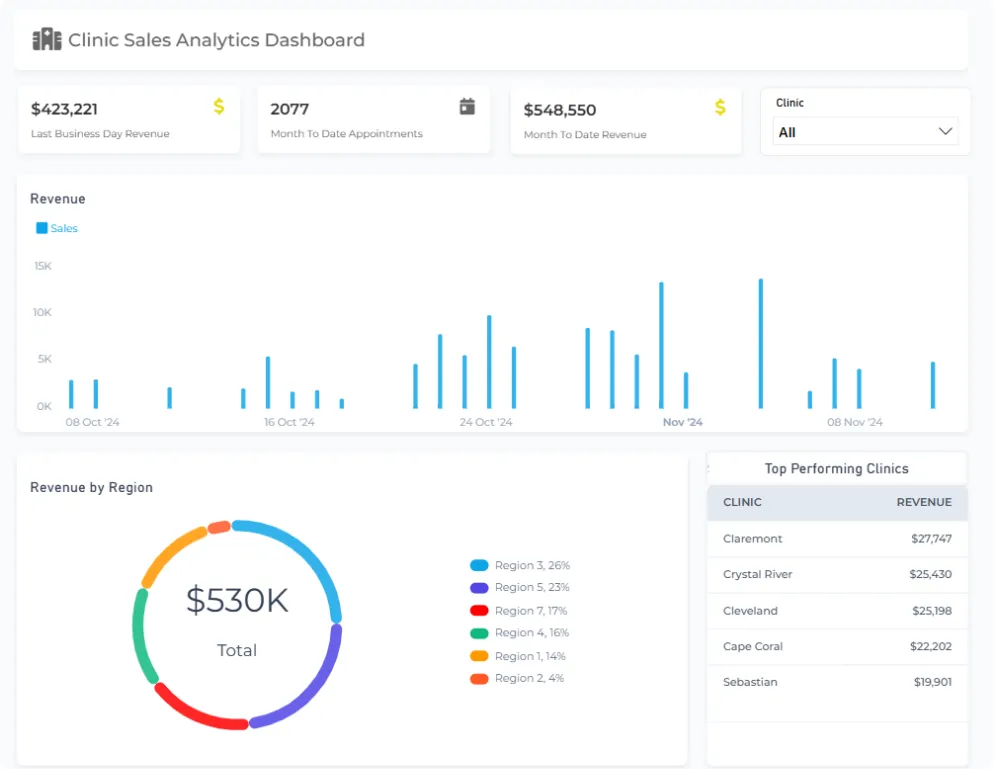
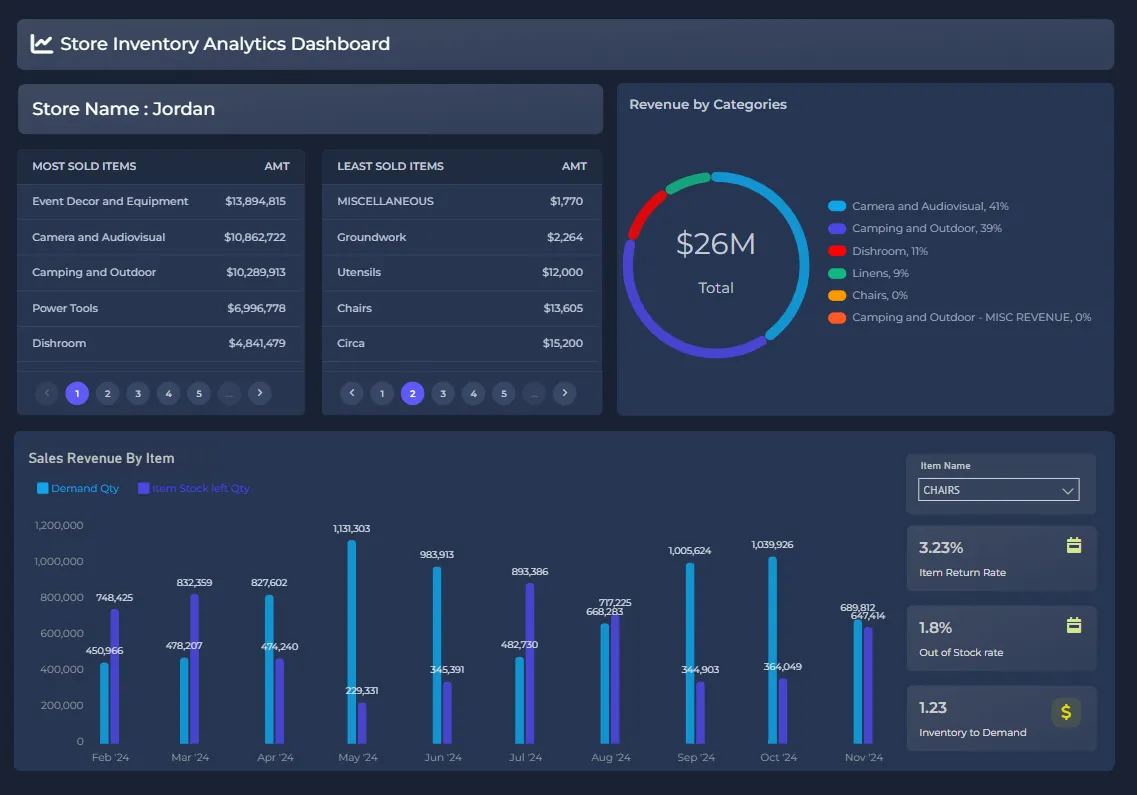
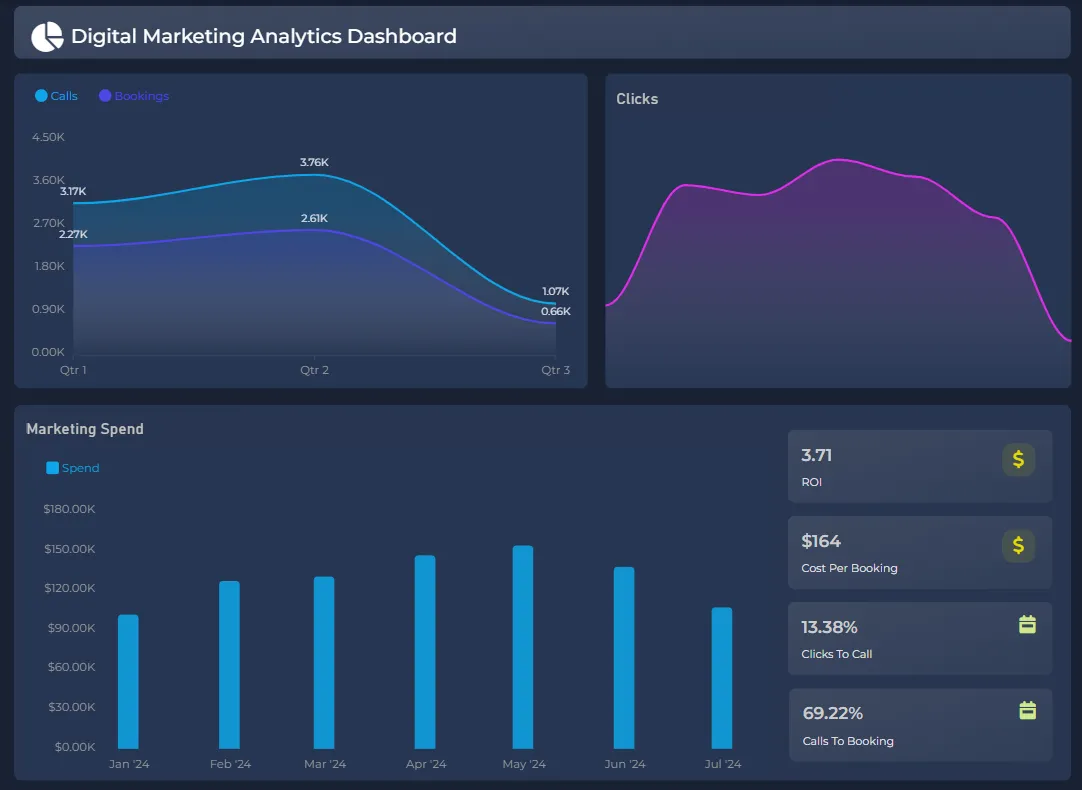
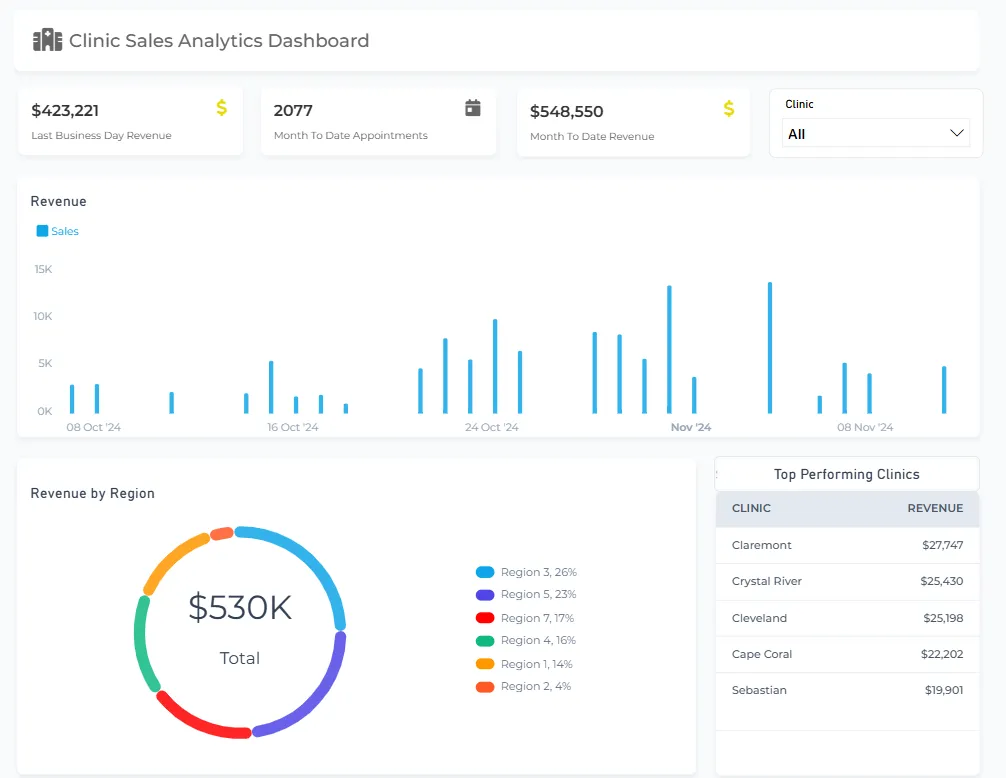
Sample dashboards used by clients.
Data has been anonymized and modified for security
For the first time, those systems stopped arguing.
They started aligning and the fog lifted.
Suddenly, they could see:
Which branches were truly profitable.
Which teams/staff were performing or underperforming.
Which sites were overstaffed or understaffed.
Which products or services deserved expansion.
Control returned and decisions became deliberate:

New locations
were modeled
after the proven profitable ones

Top-performing products and services were scaled aggressively across locations

Underperformers were coached or reassigned, raising the bar across the board

Staffing levels were adjusted to match real demand, cutting waste without hurting
That shift from reacting to commanding — is what changed everything.
That’s when the business started operating with visibility.
Scaling Without Fear
With real visibility, expansion stopped being guesswork and expansion
decisions now came with confidence instead of sleepless nights :

The result?
12 locations became 60.
And the same method worked in clinics, retail, manufacturing, and other industries too — replicate the winners, fix or close the losers.
Small Wins That Stack Into Millions
You don’t need to triple your size to feel the impact.
Even tiny tweaks created big results:

Paying closer attention to top-spending customers and
tailoring offers to them increased monthly cash flow.

Moving ad spend away from ineffective campaigns saved
$15k in one quarter

Adjusting staff schedules cut labor costs by 12% — no layoffs

Reassigning one underperforming employee boosted
margins by $8k a month
Stack these wins across multiple branches, and hundreds of
thousands in annual savings become millions as you scale.
What This Means for You
You don’t need a billion-dollar firm behind you.
Whether you've got 3 stores, 10restaurants, or 20service branches, your data already knows the truth
The question is: are you using it?
Do you know which branches are profitable after costs?
Can you spot your star staff — and your underperformers?
Are your ads creating paying customers or burning cash?
Are you making business decisions based on facts or gut feel?
If the answer is
“I don’t know,”
You’re Gambling.

Every Month You Wait, You Lose
Scaling from 12 to 60 wasn’t luck.
It was clarity.
Data analytics didn’t just save money.
It gave confidence, confidence to invest, to expand, to cut losses, and to double down on winners.


Here’s the cost of inaction: every month you rely on spreadsheets and hunches, you bleed money to wasted payroll, unprofitable ads, and “busy” branches that quietly lose.
Stop gambling with your best branches.
Copy the DNA of your winners. Fix or close the losers.
Stop guessing. Start knowing. See what your data’s been hiding in a 30-minute Free Audit
The Playbook Firms Don’t Tell You

Acquire a business with potential but
underused, messy data

Connect its systems like sales, payroll, marketing,
and finance using data analytics into one dashboard

Spot the hidden leaks and profit drivers, FAST

Scale what works, fix what doesn’t

Sell with higher margins
For them, this wasn’t just support. It was the strategy
By: Competence Analytics LLC